
National Innovation Index Report 2024
Press Releases: National Innovation Index Report 2024
Chengdu, June 12, 2025
1. About the National Innovation Index Report
Innovation is the primary driving force for development. In 2006, the Chinese government formulated and implemented the Outline of the National Medium- and Long-term Planning for Development of Science and Technology (2006-2020), which set the goal of establishing China as an innovative country by 2020. In 2022, the 20th National Congress of the CPC officially declared that China had become an innovative country, setting forth the strategic goal of reaching the forefront of innovative countries and becoming a world leader in science and technology by 2035.
In order to comprehensively monitor and evaluate the development of the country’s innovation capacity, Chinese Academy of Science and Technology for Development (CASTED) has been releasing the National Innovation Index Report annually since 2011. The report draws on theories and methods related to national competitiveness and innovation evaluation, and constructs a matrix of indicators from five dimensions, i.e., innovation resources, knowledge creation, enterprise innovation, innovation performance, and innovation environment. It provides a comprehensive analysis of 40 countries that together contribute over 95% of global R&D expenditure. The National Innovation Index is measured using an internationally recognized benchmarking method. The data presented in the report all come from databases and publications of international organizations and national statistical institutions, which ensures their international comparability and authority.
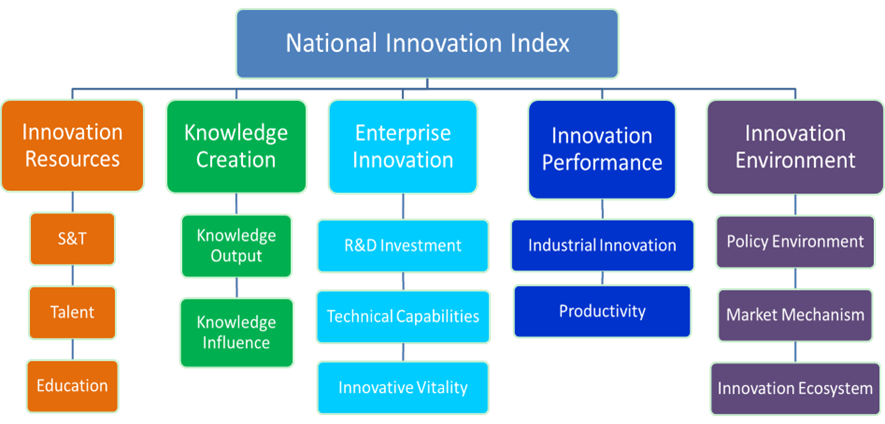
Figure 1 National Innovation Index 2024 Indicators system framework
The National Innovation Index Report 2024 is the 13th issue in this report series, with the statistical survey data from 2022 as the basis for evaluation research. Unless otherwise specified, all indicator values are based on the 2022 data.
2. Global Rankings and Findings
The 40 countries can be divided into three groups
The top 15 countries in the overall ranking, which mainly consist of developed economies in Europe, America and Asia, make up the first group. They are all well-recognized innovative countries with strong comprehensive influence on the global innovation landscape. The countries in the first group are, in order, the United States of America, Switzerland, the Republic of Korea, Sweden, Denmark, Japan, the United Kingdom, the Netherlands, Germany, China, France, Finland, Singapore, Israel and Norway.
Countries ranked between the 16th and 30th, which mainly consist of developed countries in Europe and Central Asia, make up the second group. Countries in this group all have distinctive features of innovation development. The countries in the second group are, in order, Ireland, Australia, Belgium, Austria, Iceland, Canada, Hungary, Italy, Luxembourg, Spain, New Zealand, the Czech Republic, Greece, Portugal and Poland.
Most of the countries ranking below 30th are developing countries and emerging economies, which together make up the third group. The countries in the third group are, in order, the Slovenia, Türkiye, Romania, India, Slovakia, Mexico, Argentina, South Africa, the Russian Federation and Brazil.
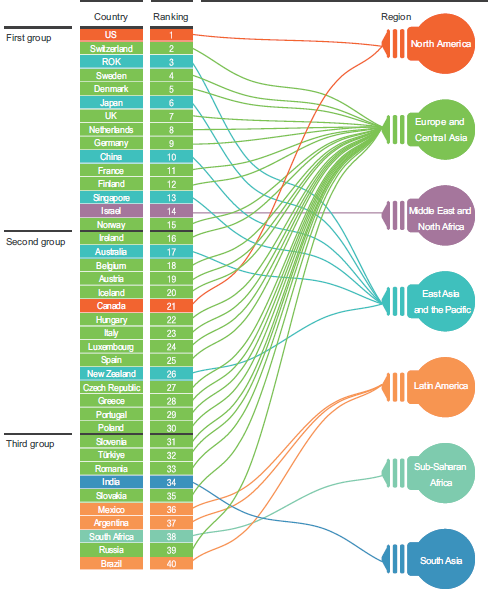
Figure 2 Global rankings of countries on National Innovation Index by three groups
Note: The continental division of countries is based on World Bank criteria.
Asia, America and Europe remain the three pillars of the global innovation landscape
North America undoubtedly remains the world’s strongest innovation pole. For the purpose of this report, the US and Canada have been selected for analysis. The two countries together represent 4.7% of the global population and 27.6% of the world’s GDP. Their combined R&D expenditure accounts for 40.2% of the world’s total, even higher than the previous year. With its comprehensive strengths, the US continues to occupy the first place in the overall NII ranking. Among the five first-level indicators, it ranks 1st in innovation resources and enterprise innovation, 3rd in knowledge creation, and 7th in innovation environment. Canada ranks 21st overall, with relatively strong performances in knowledge creation (11th) and innovation environment (8th), while ranking 18th in both innovation resources and enterprise innovation.
Europe and Central Asia have delivered strong overall performance. In this report, 26 countries have been selected for analysis, including Switzerland, Germany and France. Collectively, these 26 countries account for 9.3% of the global population, 23.8% of the global GDP, and 21.6% of the global R&D expenditure, a decrease of 2.2 percentage points from the previous year. Nine countries from this region are in the first group, while most of the others fall into the second group. Among them, Switzerland ranks 2nd overall, followed by Sweden (4th), Denmark (5th), the UK (7th), the Netherlands (8th), Germany (9th), France (11th) and Finland (12th).
Major countries in East Asia and the Pacific are also performing well, as evidenced by a clear upward trend. For the purpose of this report, six countries have been selected for analysis, including Japan, the ROK, China, Singapore, Australia and New Zealand. Collectively, these six countries account for 20.4% of the global population, 25.9% of the global GDP, and 30.4% of the global R&D expenditure, a decrease of 2.7 percentage points from the previous year. The ROK and Japan rank 2nd and 9th respectively in innovation resources, and 7th and 2nd respectively in enterprise innovation. China ranks 10th overall, becoming a highlight of innovation development in Asia and the world. Singapore and Australia rank 13th and 17th respectively overall.
In South Asia, India, which represents 17.8% of the global population and 3.3% of the global GDP, accounts for approximately 0.7% of the global R&D expenditure, a figure that has remained largely stable compared to previous years. India is in the 34th place in overall ranking, and ranks 31st in innovation performance, 25th in innovation environment, 38th in innovation resources, and 36th in both knowledge creation and enterprise innovation. Given the acceleration of its economic and social development in recent years, India’s future prospects are widely seen as promising.
In Latin America, three countries, i.e., Mexico, Argentina and Brazil, have been selected for the purpose of this report. Collectively, these three countries account for 4.9% of the global population, 4.0% of the global GDP, and 1.0% of the global R&D expenditure, a decrease of 0.6 percentage points from the previous year. Mexico, Argentina, and Brazil rank 36th, 37th, and 40th respectively in the overall NII ranking.
In the Middle East and Africa, two countries, i.e., Israel and South Africa, have been selected for the purpose of this report. Together, these two countries account for 0.9% of the global population, 0.9% of the global GDP, and 1.4% of the global R&D expenditure, basically the same as in the previous year. Israel ranks 14th overall, while South Africa ranks 38th.
Leading countries hold significant strengths in science, technology and innovation (STI)
Compared globally, the innovation gap among countries remains significant, with the majority of R&D activities and innovation outputs concentrated in the first group of countries. By calculating the population, R&D expenditure, and GDP shares of each country globally, we can see that: The first group of countries, though representing only 27.8% of the global population, contributes 84.5% of the global R&D expenditure and 63.4% of the global GDP. The second group of countries represents 3.5% of the global population, 7.6% of the global R&D expenditure, and 10.8% of the global GDP. The third group of countries accounts for 26.7% of the global population but only 3.1% of the global R&D expenditure and 11.3% of the global GDP.
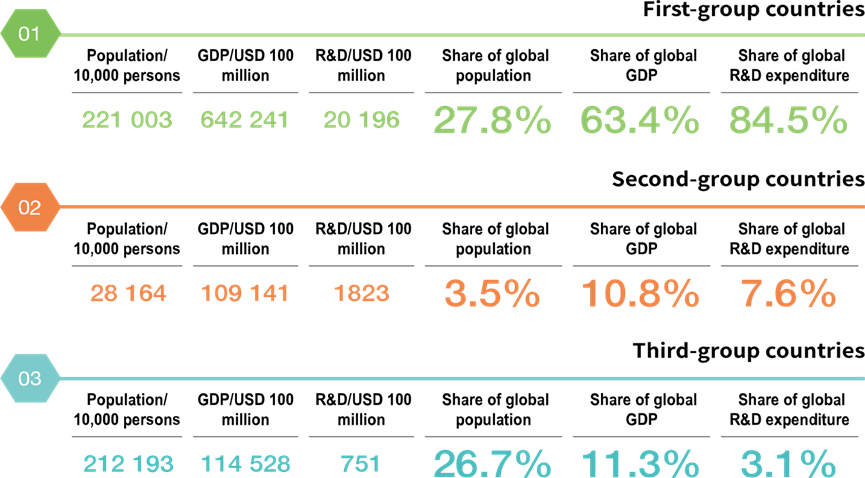
Figure 3 Position of three country-groups on the global innovation landscape in terms of major indicators.
The eastward shift of the global STI center is increasingly evident
As revealed by the changes in key NII indicators, the global STI center is gradually shifting eastward, with Asian countries rising in status on the global innovation landscape. The share of North American countries is relatively stable, while that of European countries is on the decline.
In terms of the regional distribution of R&D expenditure, East and South Asian countries in the Asian region significantly increased their global share from 27.3% in 2010 to 31.0% in 2022, up by 3.7 percentage points. China’s share in global R&D expenditure increased from 8.5% in 2010 to 20.1% in 2022, up by 11.6 percentage points, making it a key driver in the eastward shift of the global STI center. The share of North American countries increased from 35.9% in 2010 to 42.2% in 2022. Within that, the US’ share stayed at around 38% from 2015 to 2021 and went up in 2022 due to the increase in funding and changes in exchange rates. European countries have seen a notable decline in their share, dropping from 30.4% in 2010 to 22.7% in 2022, down by 7.7 percentage points. Germany, France, and the UK together account for approximately half of Europe’s R&D expenditure.
In terms of the regional distribution of R&D personnel, East and South Asian countries in the Asian region have seen a continuous rise in their global share, increasing from 40.9% in 2010 to 49.6% in 2022, up by 8.7 percentage points. Among them, China alone accounts for over one-third of the global R&D personnel, equivalent to the combined total of the US, Germany, France, the UK, Japan, the ROK, Australia and Canada. The share of North American countries slightly dropped from 17.9% in 2010 to 17.4% in 2022, with the US accounting for approximately 15.7% of the global total. The share of European countries declined more significantly, from 34.2% in 2010 to 28.1% in 2022, down by 6.1 percentage points.
The shift in the priorities of innovation resource input results in a corresponding shift in the output of innovation activities. The global share of scientific papers produced by East and South Asian countries in the Asian region climbed from 24.0% in 2010 to 45.1% in 2022, up by 21.1 percentage points. The share of North American countries dropped from 32.9% in 2010 to 23.5% in 2022, down by 9.4 percentage points. The share of European countries dropped from 50.1% in 2010 to 44.1% in 2022, down by 6 percentage points.
In terms of invention patents in force, the global share of East and South Asian countries in the Asian region rose from 56.7% in 2010 to 69.3% in 2022, up by 12.6 percentage points. The share of North American countries dropped from 30.7% in 2010 to 18.8% in 2022, down by 11.9 percentage points. The share of European countries slightly dropped from 11.7% in 2010 to 11.4% in 2022.
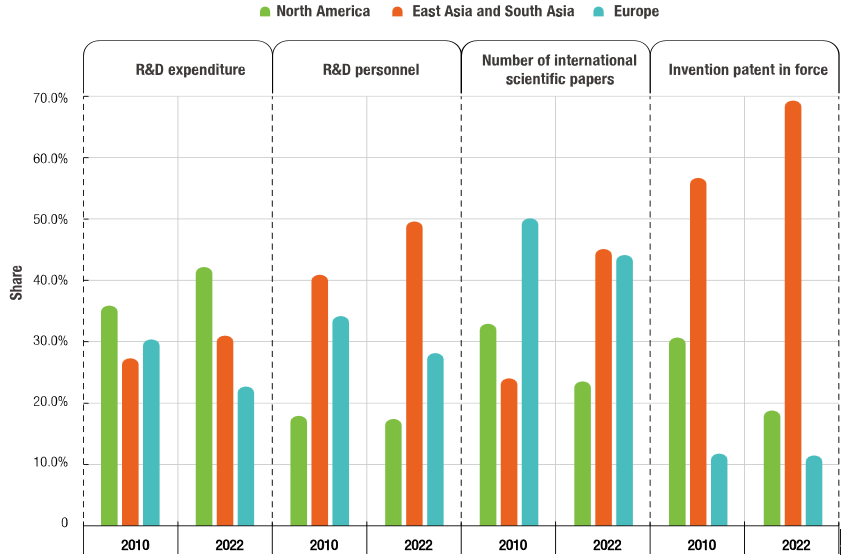
Figure 4 Changes in the share of the world’s major regions in STI input and output
3. STI Performance of Selected BRI Countries
Science and technology cooperation is an important part of the cooperation in jointly building the " Belt and Road". The BRI countries’ STI development and cooperation will strongly promote countries to jointly tap the potential of innovation growth, stimulate the potential of innovation cooperation, promote the transformation of economic growth momentum with STI, and promote common prosperity and sustainable development.
Overall National Innovation Index ranking of selected BRI countries
By May 2025, the " Belt and Road" initiative has covered over 150 countries. Among them, 19 countries are included in the 40 countries evaluated in the National Innovation Index Report 2024. These 19 BRI countries have their own characteristics in STI development.
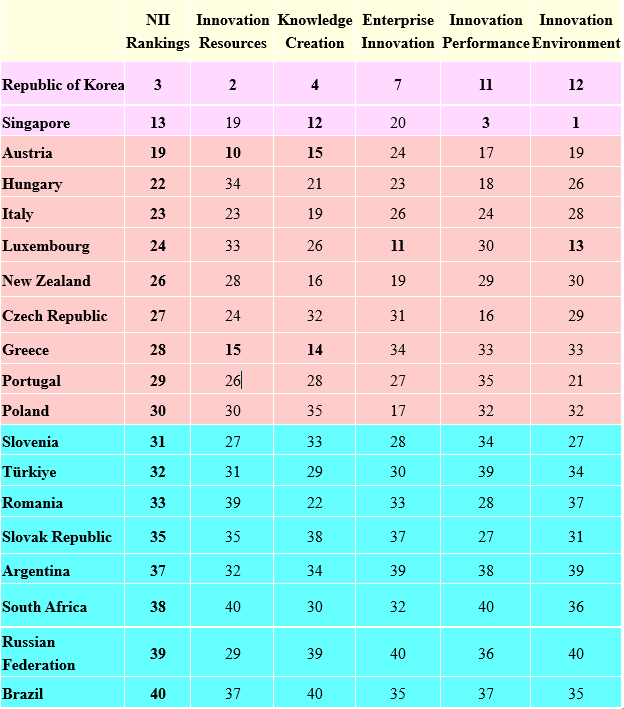
The Republic of Korea (ranked the 3rd) and Singapore (13th) have performed outstandingly, maintaining their position in the first group. 9 countries, including Austria (19th), Hungary (22nd), Italy (23rd), Luxembourg (24th), New Zealand (26th), the Czech Republic (27th), Greece (28th), Portugal (29th) and Poland (30th) ranked in the second group. 8 countries, including Slovenia(31st), Türkiye (32nd), Romania (33rd), Slovak Republic (35th), Argentina (37th), South Africa (38th), the Russian Federation (39th) and Brazil (40th), are in the third group.
Table 1 BRI countries NII ranking
Highlights of selected BRI countries’ STI performance
In terms of Innovative Resources, Luxembourg, Greece, the Czech Republic, Italy, Poland, etc., ranked in the top 15 in the proportion of basic research funding indicator. Singapore, Russia, the ROK, Slovenia, etc., had high a Proportion of STEM graduates in all college graduates. It indicates that these countries attach great importance to scientific research and the cultivation of S&T talents.
Regarding the dimension of Knowledge Creation, South Africa, Romania, Portugal, Greece, Türkiye, Slovakia, Slovenia, and Poland ranked in the top 10 in terms of the Number of S&T papers per million US$ of R&D expenditure, while ROK, Luxembourg, Argentina, Brazil, New Zealand, Russia, etc., ranked high in terms of Number of industrial design applications per 100 million US$ of industrial value-added. These countries have shown outstanding performance in Output efficiency of scientific papers and industrial designs.
Concerning the Enterprise Innovation, according to the World Bank survey, Luxembourg, New Zealand, South Africa, Singapore, Romania, Portugal, had high density of newly registered companies, and have been active in innovation and entrepreneurship activities. While Austria, Luxembourg, Italy, South Africa, etc., ranked high in terms of PCT applications per 10,000 enterprise researchers, and demonstrated strong enterprise technological competitiveness.
For the Innovation Performance, Singapore, the ROK, Hungary, the Czech Republic, Slovakia, etc., ranked in the top 15 in terms of the Proportion of high-tech and medium-high-tech industries in the total value-added of the manufacturing sector, while New Zealand, Luxembourg, Austria, Portugal, Italy, etc., ranked high in terms of Economic output per unit of CO2 emission. These countries have shown outstanding performance in Industrial structure upgrade and carbon emission control.
In the area of Innovation Environment, Singapore, Luxembourg, Austria, New Zealand, South Africa, the Czech Republic, Slovakia, Slovenia, etc., ranked high in terms of the Proportion of international co-authored papers in all domestic papers, showing outstanding performance in S&T international cooperation, while Hungary, Brazil, Greece, Poland, Romania, etc., have a leading ratio of international investment to GDP, had been attractive destinations for international investment.